The Vital Role of Detection Engineering in Effective Security Operations

In the ever-evolving landscape of cybersecurity, security teams face the constant challenge of detecting and responding to an expanding array of threats. One of the most critical components of a robust security strategy is the discipline of detection engineering. This unsung hero of the security operations (SecOps) world plays a pivotal role in ensuring that organisations can effectively identify, investigate, and mitigate security incidents.
What is Detection Engineering?
Detection engineering is the process of designing, implementing, and continuously optimizing the security controls, rules, and logic that enable the early and accurate detection of potential security threats. It involves a deep understanding of the threat landscape, the organisation’s unique risk profile, and the available security tools and technologies.
The Role of Detection Engineering in SecOps
At the heart of effective security operations lies the ability to rapidly identify and respond to security events before they can escalate into full-blown incidents. Detection engineering is the bridge that connects the vast amounts of security data generated by various tools and platforms to the actionable intelligence that security teams need to make informed decisions.
Threat Modeling and Scenario Planning
Detection engineers work closely with security analysts, incident response teams, and subject matter experts to understand the organisation’s threat landscape. They use threat modeling techniques to identify potential attack vectors, attacker behaviours, and the potential impact of successful attacks. This knowledge that informs the development of detection rules and strategies that are tailored to the organisation’s unique risk profile.
Optimizing Security Telemetry
Detection engineers are responsible for ensuring that the organisation’s security tools are configured to capture the most relevant and high-quality security data. They work to integrate various data sources, normalize the data, and remove noise and irrelevant information to create a comprehensive and accurate security telemetry.
Developing Detection Logic
Based on the threat modeling and security telemetry, detection engineers design and implement the detection rules, algorithms, and analytical processes that enable the timely identification of security incidents. This includes the creation of custom detection logic, the tuning of existing security tools, and the integration of advanced analytics techniques, such as machine learning and behavioral analysis.
Continuous Improvement
Detection engineering is an ongoing process that requires regular review, testing, and optimization. Detection engineers work closely with security analysts and incident response teams to continuously evaluate the effectiveness of the detection strategies, identify areas for improvement, and implement necessary changes to keep pace with evolving threats.
The Impact of Effective Detection Engineering
By investing in robust detection engineering practices, organisations can significantly enhance their security posture and their ability to respond to security incidents effectively. Some of the key benefits include:
Faster Incident Detection and Response
Effective detection engineering enables security teams to identify and respond to security incidents more quickly, reducing the potential for damage and minimizing the organisation’s exposure to risk.
Reduced Incident Costs
Early detection and efficient response can help organisations avoid the significant financial and reputational costs associated with security breaches.
Increased Threat Visibility
Detection engineering provides security teams with a deeper understanding of the threat landscape, allowing them to proactively adapt their defenses and better anticipate future attacks.
Improved Operational Efficiency
By streamlining security data collection and analysis, detection engineering can help security teams optimize their workflows and focus on the most critical security tasks.
Creating a Detection Engineering Lab Using the ELK Stack
The ELK Stack (Elasticsearch, Kibana and Logstash) is versatile and can be configured on Windows, Linux and MAC OS. Its setup can be complicated but thankfully there is a lot of great documentation from the ELK team and a huge community with hundreds of free resources to guide one in the setup process. Therefore we won’t be dwelling on that in this article.
Installing Elasticsearch
For the purpose of this setup, we used a Windows 11 Pro machine with an AMD Ryzen 7 PRO processor, 16GB RAM, and a 64-bit processor to ensure smooth operation.
We obtained Elasticsearch directly from the official Elastic website, leveraging their comprehensive documentation for installation guidance. This ensured that we had the latest stable version and access to all the features and updates provided by Elastic. Following the step-by-step instructions, we seamlessly installed Elasticsearch, laying a solid foundation for our ELK stack lab.

Configuring Elasticsearch: Optimizing Performance and Security
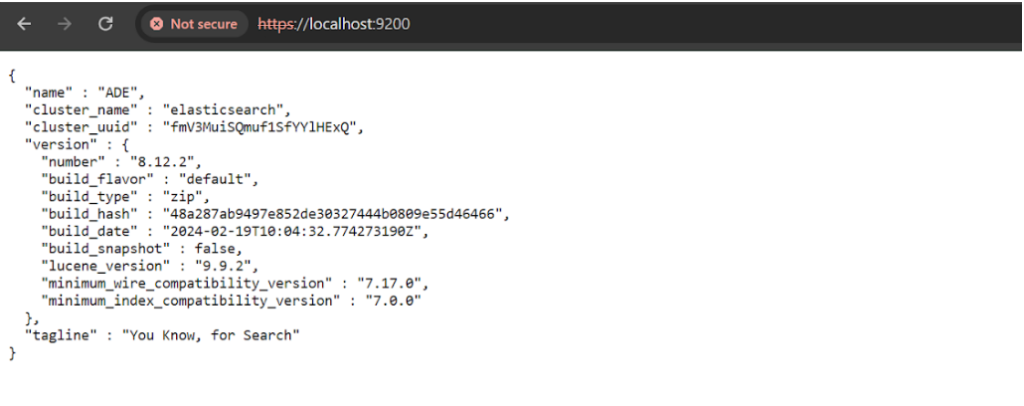
Once Elasticsearch is installed, the next step in our ELK stack setup involved configuring the elasticsearch YAML file to optimize performance and ensure security. The elasticsearch.yml file, located in the Elasticsearch config directory, serves as the central configuration file where various parameters can be customized according to specific requirements. For the purposes of this exercise, we configured elastic search to run on localhost port 9200.
After configuring Elasticsearch, the next step is to start the Elasticsearch service. This can typically be done by running a command specific to your operating system or using a service management tool. Once the Elasticsearch service is up and running, you can proceed by accessing the Elasticsearch local host URL, usually http://localhost:9200, in your web browser or through API requests.
Installing Kibana
After configuring Elasticsearch successfully, the next crucial step in our ELK stack setup is installing and setting up Kibana for data visualisation and exploration.
We download Kibana from the official Elastic website, selecting the appropriate version for our operating system. Following the provided installation instructions, we extract the downloaded archive and configure Kibana according to our preferences, which may include adjustments in the `kibana.yml` configuration file.
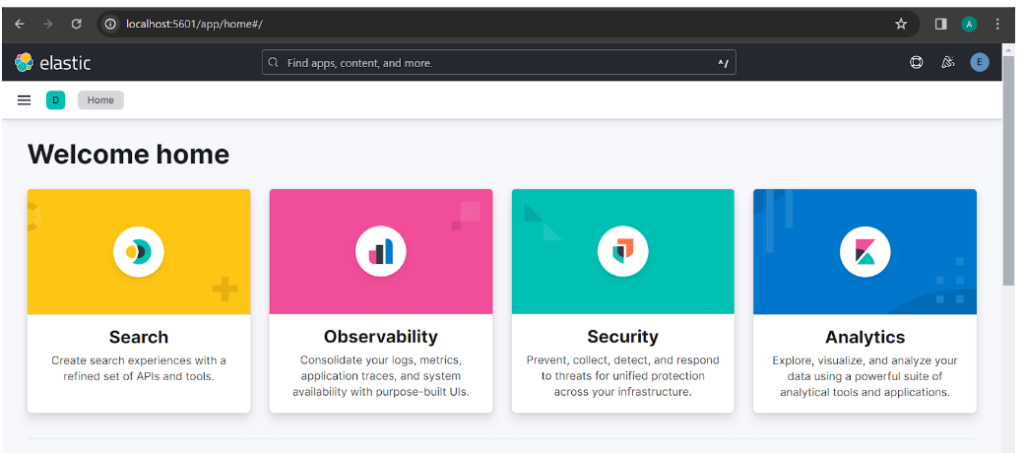
Once configured, we start the Kibana service, typically via a command specific to our operating system or a service management tool. Accessing the Kibana dashboard through its default URL localhost:5601 in a web browser, we’re ready to explore and visualise data stored in Elasticsearch. Kibana empowers us to create diverse visualisations like charts, graphs, and maps, allowing us to build interactive dashboards and gain valuable insights from our data. With Kibana installed and configured, our ELK stack is fully operational, enabling seamless data ingestion, storage, analysis, and visualisation for our organisation’s needs.
Collecting Windows logs with Winlogbeat
The ELK itself has no use if it can’t get the logs from your devices, threfore winlogbeat was used here.
For integrating Windows event logs into our ELK stack, Winlogbeat serves as a lightweight and efficient option. Installing Winlogbeat involves downloading the appropriate version from the official Elastic website and extracting the files to “C:\Program Files” on the Windows machine. Once extracted, configuration adjustments are made in the “winlogbeat.yml” file, where users can specify Elasticsearch and Kibana details for log forwarding and visualisation. Configuration options also include defining which event logs to monitor and how to process and ship them to Elasticsearch.
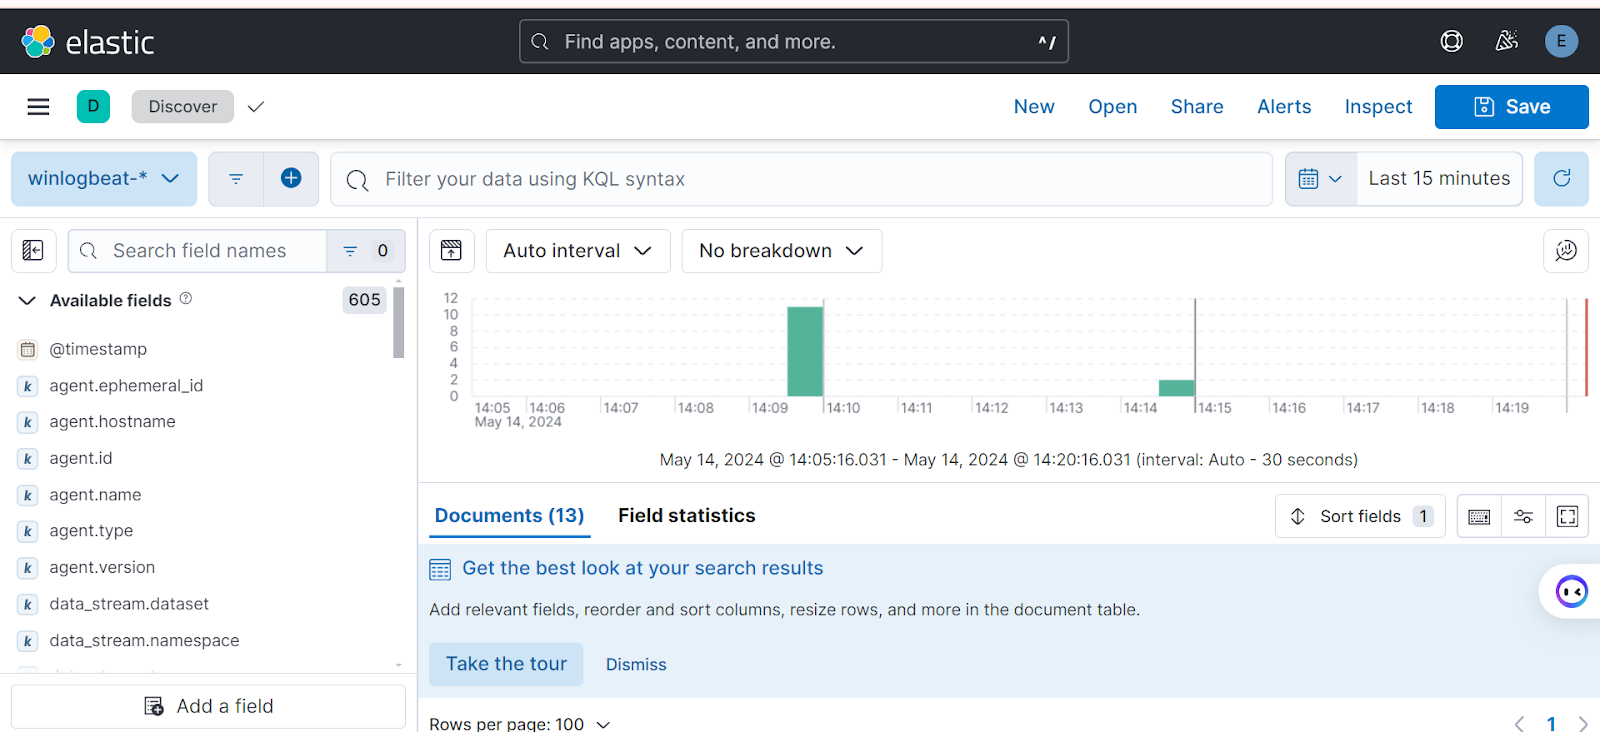
After configuring Winlogbeat to meet our requirements, the service is started either via the command line or the service management tool. Once running, Winlogbeat continuously monitors specified event logs, parses the events, and forwards them to Elasticsearch for indexing. This seamless integration enables real-time log analysis and visualisation through Kibana, empowering us to gain valuable insights and effectively manage our Windows-based systems within our ELK stack environment.
Building Detection Rules
To enhance the security monitoring capabilities of our ELK stack, we’ll create our first detection rule in Kibana. This rule will help us detect failed login attempts, which could indicate potential security threats. To start, navigate to the detection rules interface by going to `Security`, then `Alerts`, followed by `Manage rules`, and finally selecting `Create new rule`.

Brute Force Detection Rule
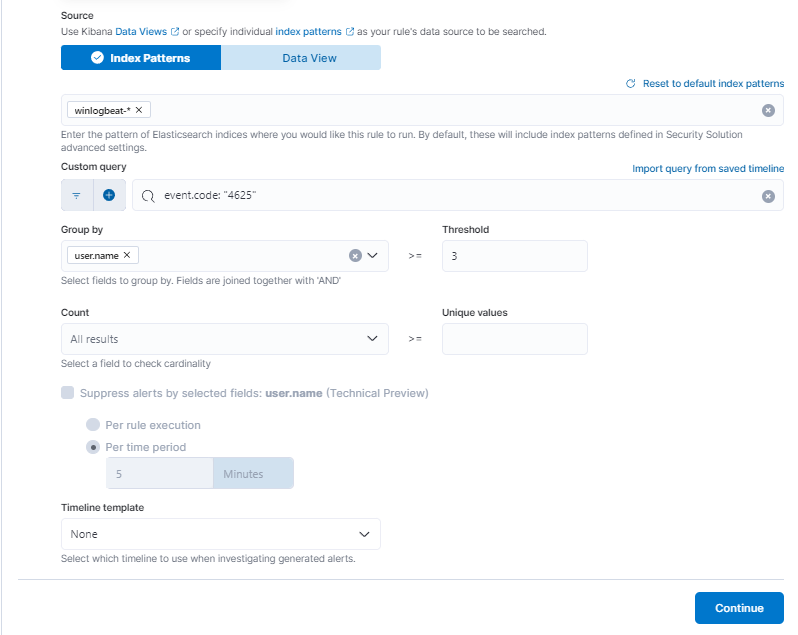
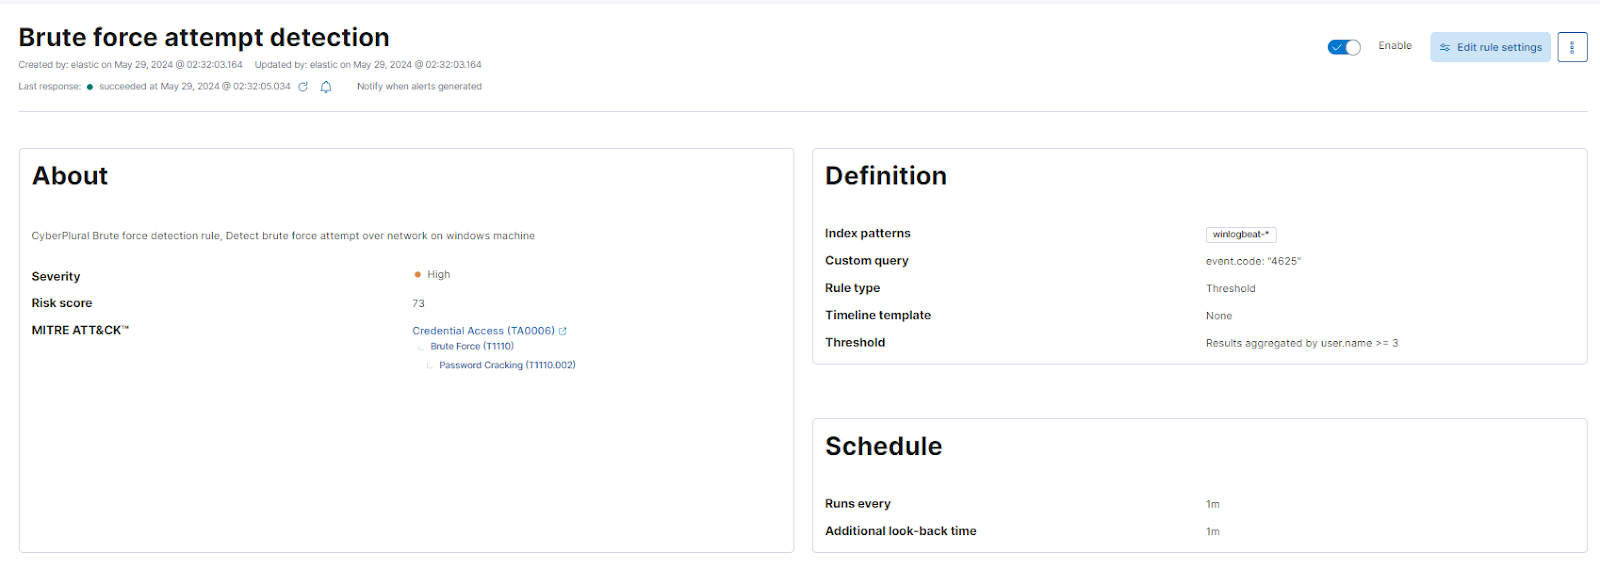
In configuring the detection rule, we first choose the `Threshold` rule type. Next, we specify the index pattern as `winlogbeat-*`, which directs Kibana to monitor the logs coming from Winlogbeat. We then define a custom query with `event.code: “4625”`, which filters the logs to identify failed login attempts. To fine-tune the rule, we set it to group by `user.name` and establish a threshold of 3. This means that if there are more than three failed login attempts (event code 4625) for any user within a given period, an alert will be triggered.

The logic of this rule is straightforward: it monitors for event code `4625`, indicating a failed login attempt, and triggers an alert if this event occurs more than three times for a single user within a one-minute window. After defining the rule logic, we proceed to name and describe the detection rule, providing a clear understanding of its purpose and scope.

Next, we configure the rule to run every minute, ensuring continuous monitoring and prompt detection of suspicious activity. The look-back time is also set to one minute, meaning the rule will analyze data from the last minute to detect any threshold breaches. This configuration ensures that our monitoring is both frequent and timely.


After saving the detection rule, we can preview it on the right side of the screen, where the `Rule Preview` simulates the detection and shows the expected results based on current data. This preview helps verify that the rule is correctly configured and ready to detect the specified events.
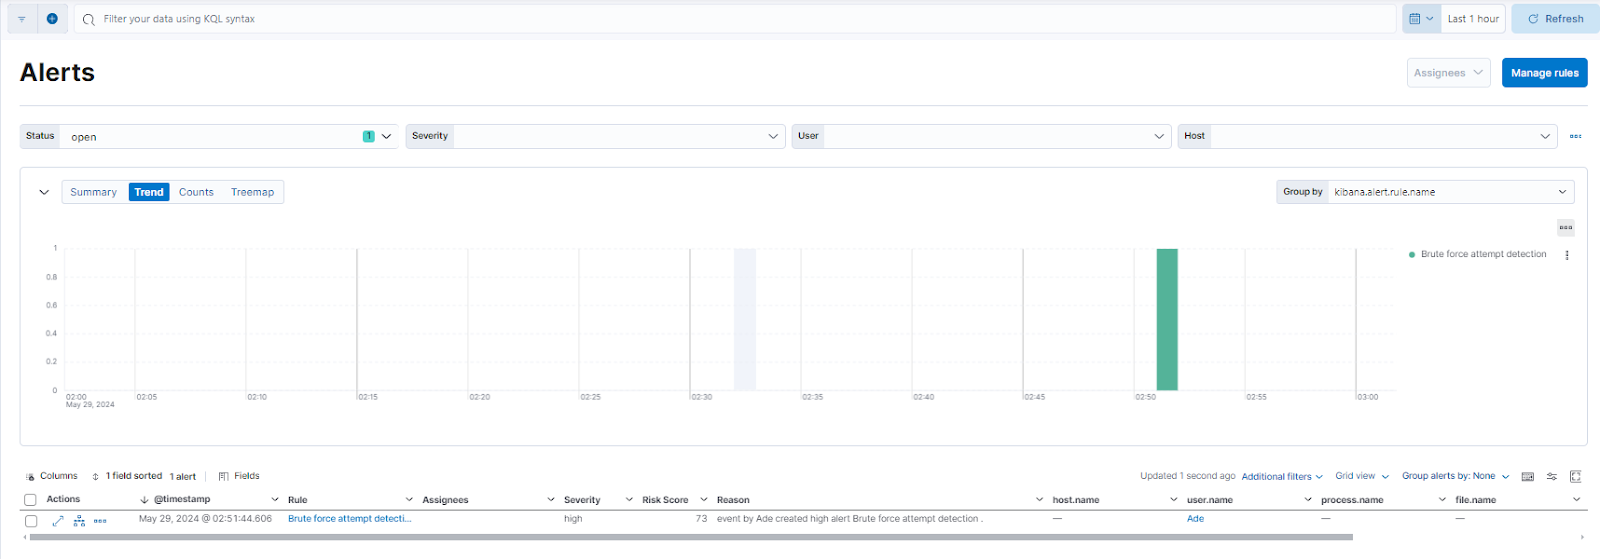
Finally, to validate and test the rule, we can run a simulated attack using Metasploit, specifically targeting SMB services to generate failed login attempts. After running the attack, we can check the `Alerts` page in Kibana to confirm that our detection rule successfully triggers an alert. This proactive monitoring setup is crucial for maintaining a secure environment, allowing us to respond swiftly to any suspicious activities and potential security threats.
Volume Shadow Copy Deleted Rule
To enhance our security monitoring capabilities in Kibana, we will create a detection rule to identify the use of vssadmin.exe for deleting or resizing shadow copies, which is a common tactic employed in ransomware and other destructive attacks. To begin, navigate to the detection rules interface by going to Security, then Alerts, followed by Manage rules, and finally selecting Create new rule.
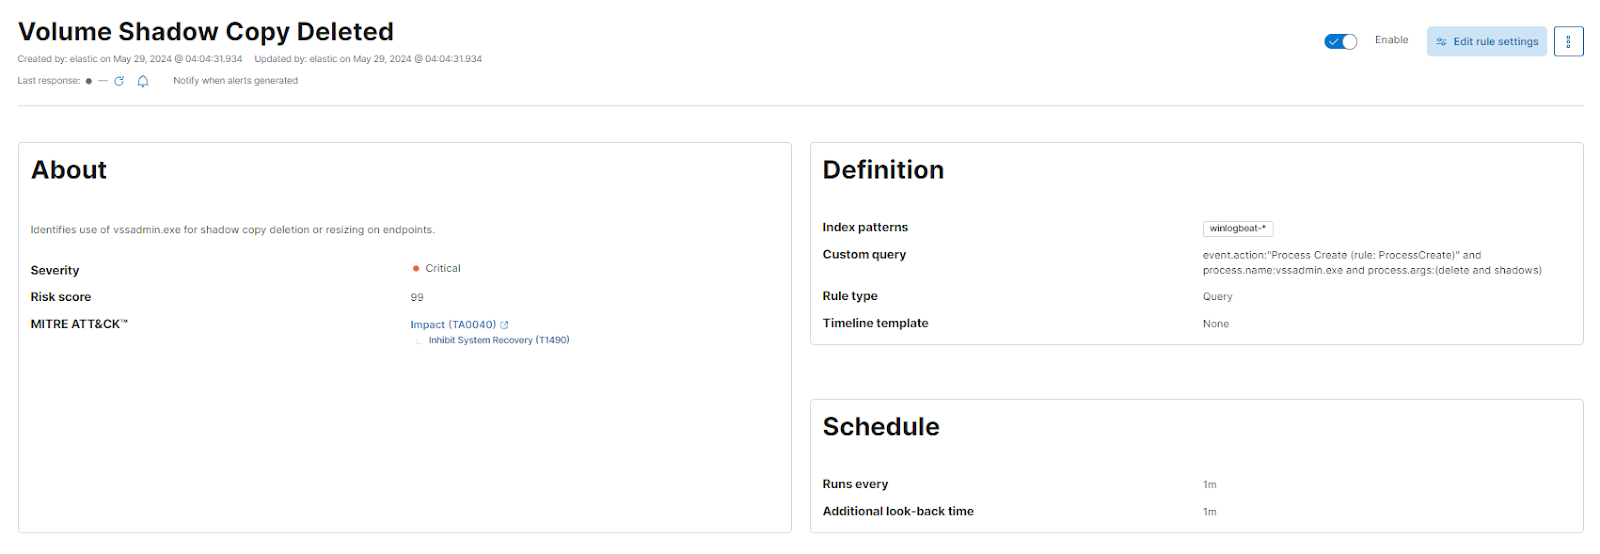
In configuring this rule, we will select the EQL (Event Query Language) rule type. The rule will monitor the index pattern: winlogbeat-*. We will set the severity of this rule to critical and assign a risk score of 99. To ensure timely detection, the rule will run every 1 minute and look back over the last 9 minutes to search for relevant events. Additionally, we will limit the maximum number of alerts per execution to 100.

To facilitate easier identification and categorization, we will tag the rule with relevant keywords such as Elastic, Host, Windows, Threat Detection, and Impact. For threat mapping, we will align the rule with the MITRE ATT&CK framework. Specifically, it will map to the Impact tactic (TA0040) and the Inhibit System Recovery technique (T1490).
The core of the rule logic involves an EQL query designed to detect the deletion or resizing of volume shadow copies. The query will identify processes where vssadmin.exe is executed with arguments related to deleting or resizing shadow copies:
process where process.name == “vssadmin.exe” and process.args in (“delete shadows”, “resize shadowstorage”)
This query ensures that we capture the specific activities associated with tampering with volume shadow copies.
We will provide a descriptive name and description for the rule to clearly outline its purpose. The rule will be named “Volume Shadow Copy Deleted Rule” with the description, “Identifies use of vssadmin.exe for shadow copy deletion or resizing on endpoints. This commonly occurs in tandem with ransomware or other destructive attacks.” The rule will be configured to run every 1 minutes, ensuring continuous and timely monitoring.
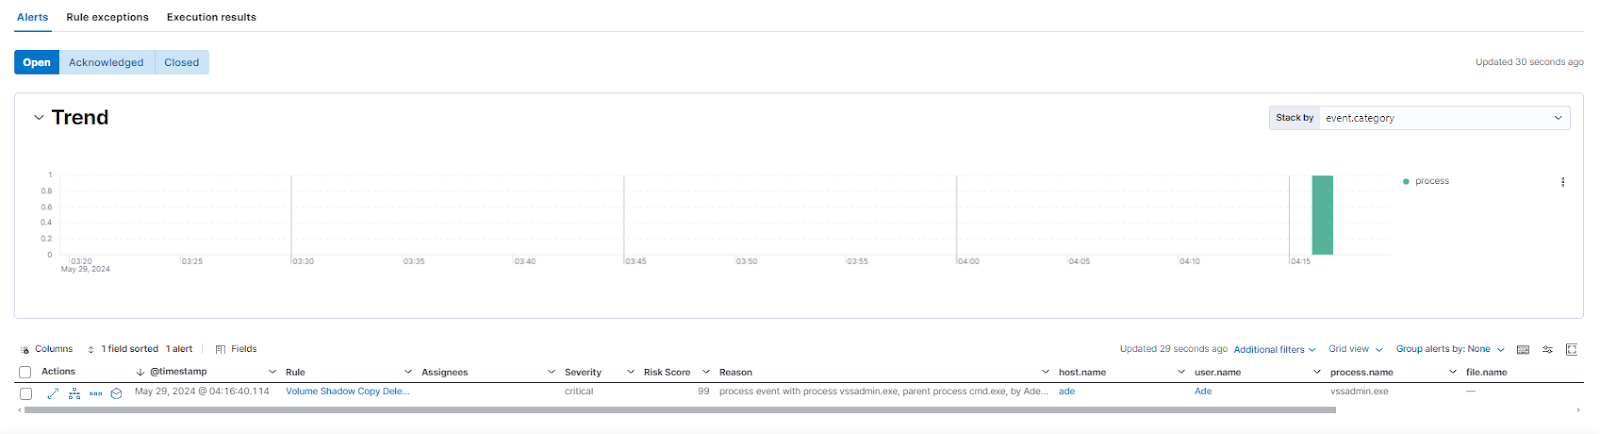
After configuring all the parameters, we will save the rule and preview it to ensure it accurately captures the desired events. Once saved, the rule will monitor for the specified activities, and any detection will trigger an alert. This proactive approach significantly enhances our ability to identify and respond to potential ransomware attacks or other malicious activities involving the tampering of volume shadow copies, thereby strengthening our overall security posture.
As the adoption of AI and ML in cybersecurity continues to grow, the integration of these technologies into detection engineering will become increasingly essential. By harnessing the power of AI-infused detection capabilities, security operations teams can enhance their threat detection, streamline their incident response, and ultimately, better protect their organisations from evolving cyber threats.
In conclusion, detection engineering is a crucial component of a comprehensive security operations strategy. By investing in the development and continuous optimization of effective detection capabilities, organisations can enhance their resilience, reduce their risk, and stay one step ahead of the ever-evolving threat landscape.
Leave a Reply